Terms & Conditions
Ecocoast Terms of Website Use
Please read these terms and conditions carefully before using this site
ACCEPTANCE OF THE TERMS OF WEBSITE USE
This terms of use (together with the documents referred to in it) tells you the terms of use on which you may make use of our website www.ecocoast.com (“our site”), whether as a guest or a registered user. Use of our site includes accessing, browsing, or registering to use our site.
Please read these terms of use carefully before you start to use our site, as these will apply to your use of our site. We recommend that you print a copy of this for future reference.
By using our site, you confirm that you accept these terms of use and that you agree to comply with them.
If you do not agree to these terms of use, you must not use our site.
OTHER APPLICABLE TERMS
These terms of use refer to the following additional terms, which also apply to your use of our site:
Our Privacy and Cookie Policy, which sets out the terms on which we process any personal data we collect from you, or that you provide to us, and information about the cookies on our site. By using our site, you consent to such processing and you warrant that all data provided by you is accurate.
INFORMATION ABOUT US
www.ecocoast.com is a site operated by Ecocoast Contracting LLC (“We“). We are registered in Department of Economy and Tourism, Dubai, United Arab Emirates and have our head office at CEO Building, Office 506-507, Dubai Investment Park 1, PO Box 72768, Dubai, United Arab Emirates.
CHANGES TO THESE TERMS
We may revise these terms of use at any time by amending this page.
Please check this page from time to time to take notice of any changes we made, as they are binding on you.
CHANGES TO OUR SITE
We may update our site from time to time, and may change the content at any time. However, please note that any of the content on our site may be out of date at any given time, and we are under no obligation to update it.
We do not guarantee that our site, or any content on it, will be free from errors or omissions.
ACCESSING OUR SITE
Our site is made available free of charge.
We do not guarantee that our site, or any content on it, will always be available or be uninterrupted. Access to our site is permitted on a temporary basis. We may suspend, withdraw, discontinue or change all or any part of our site without notice. We will not be liable to you if for any reason our site is unavailable at any time or for any period.
You are responsible for making all arrangements necessary for you to have access to our site.
You are also responsible for ensuring that all persons who access our site through your internet connection are aware of these terms of use and other applicable terms and conditions, and that they comply with them.
We do not represent that content available on or through our site is available in other locations. We may limit the availability of our site or any service or product described on our site to any person or geographic area at any time.
YOUR ACCOUNT AND PASSWORD
If you choose, or you are provided with, a user identification code, password or any other piece of information as part of our security procedures, you must treat such information as confidential. You must not disclose it to any third party.
We have the right to disable any user identification code or password, whether chosen by you or allocated by us, at any time, if in our reasonable opinion you have failed to comply with any of the provisions of these terms of use.
If you know or suspect that anyone other than you knows your user identification code or password, you must promptly notify us at [email protected].
INTELLECTUAL PROPERTY RIGHTS
We are the owner or the licensee of all intellectual property rights in our site, and in the material published on it. Those works are protected by copyright laws and treaties around the world. All such rights are reserved.
You may print off one copy, and may download extracts, of any page(s) from our site for your personal use and you may draw the attention of others within your organisation to content posted on our site.
You must not modify the paper or digital copies of any materials you have printed off or downloaded in any way, and you must not use any illustrations, photographs, video or audio sequences or any graphics separately from any accompanying text.
Our status (and that of any identified contributors) as the authors of content on our site must always be acknowledged.
You must not use any part of the content on our site for commercial purposes without obtaining a licence to do so from us or our licensors.
If you print off, copy or download any part of our site in breach of these terms of use, your right to use our site will cease immediately and you must, at our option, return or destroy any copies of the materials you have made.
NO RELIANCE ON INFORMATION
The content on our site is provided for general information only. It is not intended to amount to advice on which you should rely. You must obtain professional or specialist advice before taking, or refraining from, any action on the basis of the content on our site.
Although we make reasonable efforts to update the information on our site, we make no representations, warranties or guarantees, whether express or implied, that the content on our site is accurate, complete or up-to-date.
LIMITATION OF OUR LIABILITY
To the extent permitted by law, we exclude all conditions, warranties, representations or other terms which may apply to our site or any content on it, whether express or implied.
We will not be liable to any user for any loss or damage, whether in contract, tort (including negligence), breach of statutory duty, or otherwise, even if foreseeable, arising under or in connection with:
- Use of, or inability to use, our site; or
- Use of or reliance on any content displayed on our site.
- If you are a business user, please note that in particular, we will not be liable for:
- Loss of profits, sales, business, or revenue;
- Business interruption;
- Loss of anticipated savings;
- Loss of business opportunity, goodwill or reputation; or
- Any indirect or consequential loss or damage.
You agree not to use our site for any commercial or business purposes, and we have no liability to you for any loss of profit, loss of business, business interruption, or loss of business opportunity.
We will not be liable for any loss or damage caused by a virus, distributed denial-of-service attack, or other technologically harmful material that may infect your computer equipment, computer programs, data or other proprietary material due to your use of our site or to your downloading of any content on it, or on any website linked to it.
We assume no responsibility for the content of websites linked on our site. Such links should not be interpreted as endorsement by us of those linked websites. We will not be liable for any loss or damage that may arise from your use of them.
UPLOADING CONTENT TO OUR SITE
Whenever you make use of a feature that allows you to upload content to our site, or to make contact with other users of our site, you must comply with the content standards set out in our Acceptable Use Policy.
You warrant that any such contribution does comply with those standards, and you will be liable to us and indemnify us for any breach of that warranty.
Any content you upload to our site will be considered non-confidential and non-proprietary. You retain all of your ownership rights in your content, but you are required to grant us and other users of the Site a limited licence to use, store and copy that content and to distribute and make it available to third parties. The rights you license to us are described in the next paragraph (“Rights you licence”).
We also have the right to disclose your identity to any third party who is claiming that any content posted or uploaded by you to our site constitutes a violation of their intellectual property rights, or of their right to privacy.
We will not be responsible, or liable to any third party, for the content or accuracy of any content posted by you or any other user of our site.
We have the right to remove any posting you make on our site if, in our opinion, your post does not comply with the content standards set out in our Acceptable Use Policy.
The views expressed by other users on our site do not represent our views or values.
You are solely responsible for securing and backing up your content.
VIRUSES
We do not guarantee that our site will be secure or free from bugs or viruses.
You are responsible for configuring your information technology, computer programmes and platform in order to access our site. You should use your own virus protection software.
You must not misuse our site by knowingly introducing viruses, trojans, worms, logic bombs or other material which is malicious or technologically harmful. You must not attempt to gain unauthorised access to our site, the server on which our site is stored or any server, computer or database connected to our site. You must not attack our site via a denial-of-service attack or a distributed denial-of service attack. We will report any such breach to the relevant law enforcement authorities and we will co-operate with those authorities by disclosing your identity to them. In the event of such a breach, your right to use our site will cease immediately.
LINKING TO OUR SITE
You may link to our home page, provided you do so in a way that is fair and legal and does not damage our reputation or take advantage of it.
You must not establish a link in such a way as to suggest any form of association, approval or endorsement on our part where none exists.
You must not establish a link to our site in any website that is not owned by you.
Our site must not be framed on any other site, nor may you create a link to any part of our site other than the home page.
We reserve the right to withdraw linking permission without notice.
The website in which you are linking must comply in all respects with the content standards set out in our Acceptable Use Policy.
If you wish to make any use of content on our site other than that set out above, please contact [email protected].
THIRD PARTY LINKS AND RESOURCES IN OUR SITE
Where our site contains links to other sites and resources provided by third parties, these links are provided for your information only.
We have no control over the contents of those sites or resources.
GOVERNING LAW AND JURISDICTION
All matters relating to these Terms of Use and any dispute or claim arising therefrom or related thereto (in each case, including non-contractual disputes or claims) shall be governed by and construed in accordance with the laws in force in the Emirate of Dubai, United Arab Emirates without giving effect to any choice or conflict of law provision or rule (whether of the United Arab Emirates or any other jurisdiction).
Any legal suit, action or proceeding arising out of, or related to, these Terms of Use or the website shall be instituted exclusively in the courts of Dubai, United Arab Emirates although we retain the right to bring any suit, action or proceeding against you for breach of these Terms of Use in your place or country of residence or any other relevant country. You waive any and all objections to the exercise of jurisdiction over you such courts and to venue in such courts.
LIMITATION ON TIME TO FILE CLAIMS
Any cause of action or claim you may have arising out of or relating to these terms of use or the website must be commenced with one (1) year after the cause of action accrues, otherwise, such cause of action or claim is permanently barred.
WAIVER AND SEVERABILITY
No waiver by Ecocoast of any term or condition set forth in these Terms of Use shall be deemed a further or continuing waiver of such term or condition or a waiver of any other term or condition, and any failure of Ecocoast to assert a right or provision under these Terms of Use shall not constitute a waiver of such right or provision.
If any provision of these Terms of Use is held by a court or other tribunal of competent jurisdiction to be invalid, illegal or unenforceable for any reason, such provision shall be eliminated or limited to the minimum extent such that the remaining provisions of the Terms of Use will continue in full force and effect.
CONTACT US
To contact us, please email [email protected].
Thank you for visiting our site.

 LIVE
LIVE

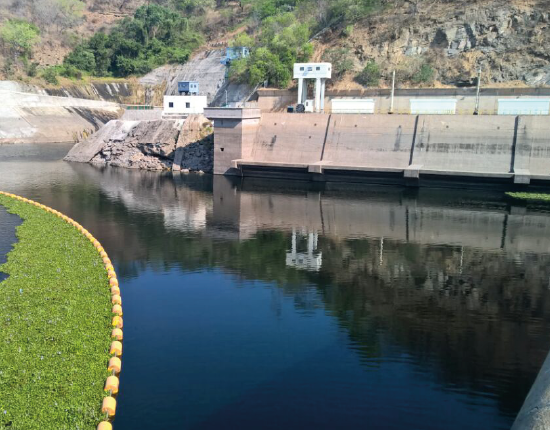
 Kariba Dam, Zambia
 Similar Case Studies